
CMJ Force-Time Analysis: More Than Just Jump Height
A countermovement jump tells you more than how high an athlete jumped. How to standardize CMJ testing, which force-time metrics to track, and how to tell a real change from normal variability.
Published August 27, 2026 · 21 min read
The Countermovement Jump (CMJ) is one of the most widely used tests of lower-body neuromuscular performance. In strength and conditioning, it is commonly used to assess an athlete’s ability to produce force and power during a vertical jump, but its application extends far beyond simply measuring jump height (Markovic et al., 2004; Claudino et al., 2017).
This article is the deeper companion to our countermovement jump guide, which covers what the test is, how a force plate captures it and what a good score looks like. Here we focus on the force-time curve itself: what it tells you, and how to interpret it.
The CMJ provides information not only about the athlete’s performance output, but also about the movement strategy used to achieve that result. Analysing the force-time curve reveals characteristics the final outcome alone does not capture: the duration of individual phases, force, impulse and temporal characteristics during the braking and propulsive phases, and the contribution of the left and right lower limbs (Barker et al., 2018; Sole et al., 2018). These characteristics can help us build a more detailed profile of the athlete and identify areas that may be relevant to performance or during the return-to-sport process.
For this reason, CMJ testing is widely used in performance sport, strength and conditioning, neuromuscular monitoring (Claudino et al., 2017), as well as rehabilitation and return-to-sport settings (Kotsifaki et al., 2023). It can help us profile performance, movement strategy and inter-limb contribution. At the same time, it is important to recognise that the CMJ does not provide a complete picture of an athlete on its own, and its results should always be interpreted within a broader context.
The CMJ is therefore much more than a test of jump height. It provides information about both the outcome and the strategy an athlete used to produce that outcome.
How to Standardize CMJ Testing
For CMJ data to be reliable and comparable over time, testing conditions need to remain as consistent as possible. If the goal is to monitor changes in an athlete’s performance longitudinally, the same testing conditions should be maintained from one session to the next. Although the CMJ generally demonstrates good test-retest reliability, reliability can differ between variables and may also be influenced by the testing protocol (Markovic et al., 2004; Howarth et al., 2022).
One of the most important considerations is to use the same measurement system and the same method of data processing whenever possible. Force plates, contact mats, optical systems and mobile technologies can use different methods to measure or calculate jump height, meaning that results from different systems may not be directly interchangeable. For longitudinal monitoring, it is therefore preferable to use the same device and methodology over time (Rago et al., 2018).
The way the jump itself is performed is equally important. Coaches should decide in advance whether athletes will jump with an arm swing or with their hands on their hips, how the countermovement will be performed, and which instructions will be given before each attempt. The use of an arm swing can alter CMJ outcomes and may also influence some force-time and asymmetry variables. For this reason, arm-swing and no-arm-swing CMJs should be treated as different testing protocols (Heishman et al., 2019; Heishman et al., 2020).
Basic Recommendations for Standardization
- Begin each test from a stable and still position.
- Keep the hands on the hips throughout the movement when using a no-arm-swing protocol.
- Do not allow a preliminary jump or any additional movement before the countermovement.
- Use a self-selected countermovement depth.
- Provide the same instructions at every testing session.
- Keep the number of attempts and rest periods between attempts consistent.
Countermovement depth can influence jump height as well as several biomechanical and force-time variables. For this reason, changes in movement strategy should also be considered when interpreting longitudinal data (Sánchez-Sixto et al., 2018; McHugh et al., 2024).
If CMJ testing is used for longitudinal monitoring, it is also useful to keep the testing time and general conditions similar between sessions. Time of day can influence CMJ performance and may therefore complicate the interpretation of changes over time (Heishman et al., 2017).
The number of attempts and the rest period between them should also remain consistent. One practical approach is to use three maximal jumps with approximately 60–90 seconds of rest between attempts. The exact protocol can vary depending on the purpose of testing, but once a protocol has been selected, consistency becomes the priority.
Changes in the testing protocol can influence results enough to make it difficult to determine whether we are observing a true change in the athlete’s performance or simply the effect of a different testing procedure. In practice, this means paying close attention to when, where and how the athlete is tested. For the exact step-by-step protocol we use, see the CMJ instructions in our Test Library.
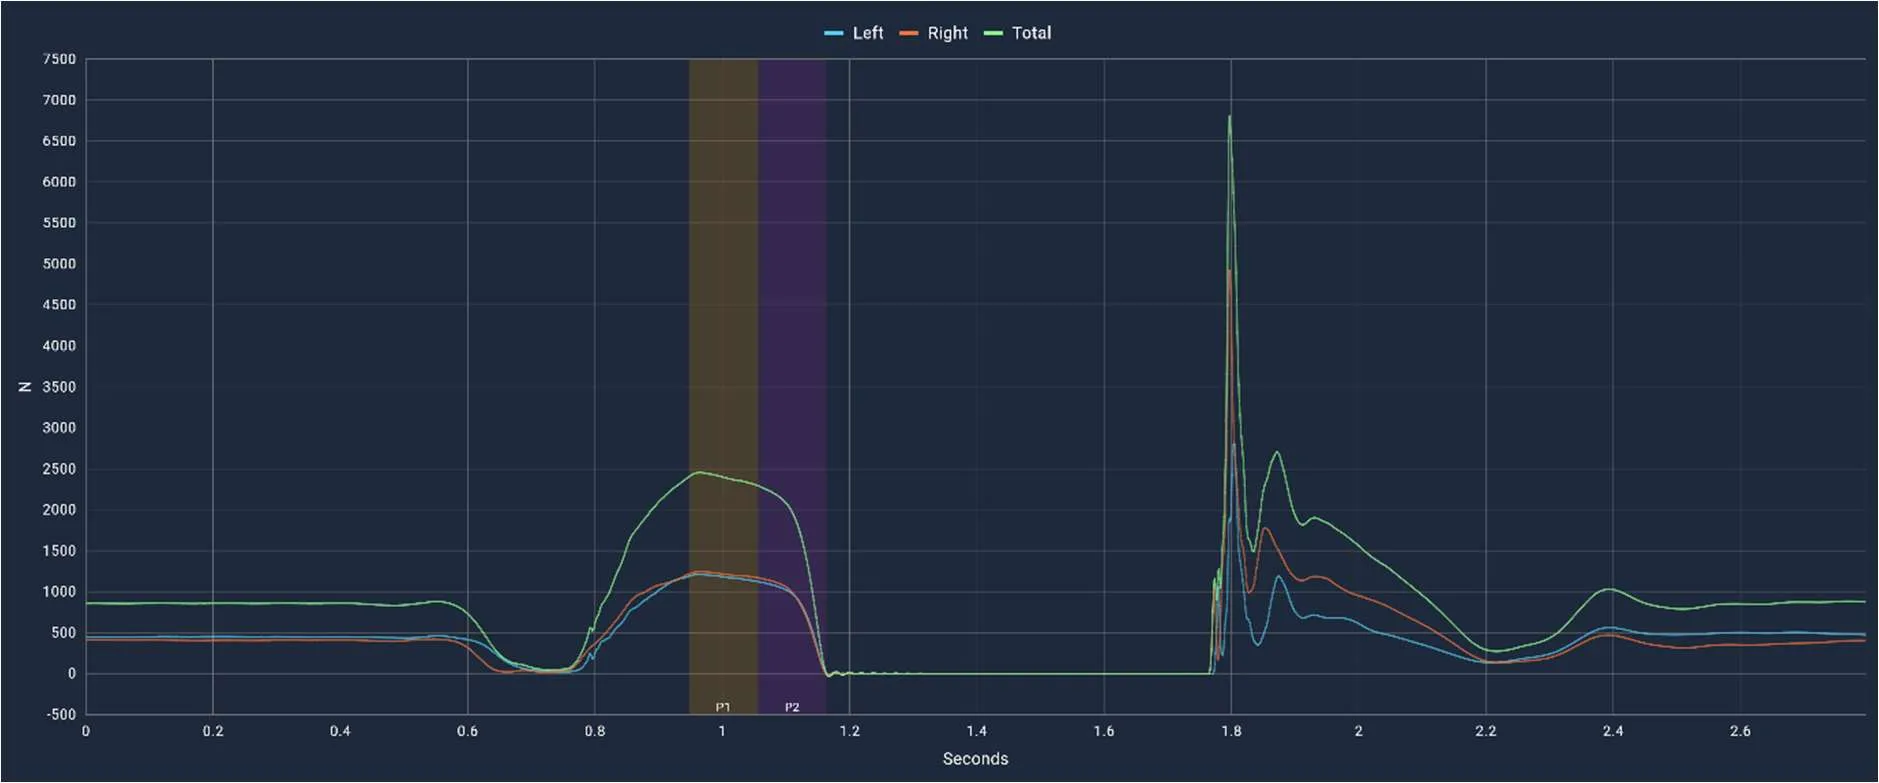
Figure 1: Force-Time graph of CMJ test. Source: CC Athletics testing data.
Common Mistakes During CMJ Testing
Even relatively small technical errors can influence the quality and interpretation of CMJ data.
- Movement before the jump: The athlete should remain completely still during the weighing phase and immediately before initiating the movement. Shifting body weight, talking or making small movements can affect the initial force measurement.
- Using the arms during a no-arm-swing protocol: If the test is performed with the hands on the hips, they should remain there throughout the entire movement. Introducing an arm swing changes the mechanics of the jump and reduces comparability between attempts.
- Changing countermovement speed or depth: Large changes in countermovement depth or downward velocity between testing sessions can affect several force-time variables. During longitudinal monitoring, it is therefore important to consider whether the athlete has substantially changed their movement strategy.
- Inconsistent position during flight or landing: When jump height is calculated from flight time, changes in lower-limb position during flight or landing can influence the estimated jump height. When jump height is calculated using an impulse-momentum method before take-off (the method ForceMate uses), landing position does not directly affect the calculation.
- Unstable landing: The athlete should maintain balance on landing. An unstable landing can alter the distribution of force between the left and right limbs and potentially distort asymmetry measures.
CMJ vs. Squat Jump: What Does EUR Really Tell Us?
The difference between the Countermovement Jump (CMJ) and the Squat Jump (SJ) is important because the two tests are performed differently and therefore provide different information. In the CMJ, the athlete performs a rapid downward movement before take-off. In contrast, the SJ starts from a static squat position without a preceding countermovement. The aim of the SJ is to minimize the contribution of the countermovement and the stretch-shortening cycle, providing a clearer view of the athlete’s ability to produce force and power during the propulsive phase with reduced contribution from mechanisms associated with the preceding countermovement and SSC (Van Hooren & Zolotarjova, 2017; Kozinc et al., 2022).
One of the most commonly used measures when comparing these two tests is the Eccentric Utilization Ratio (EUR). It is typically calculated as:
EUR = CMJ Jump Height / SJ Jump Height
EUR is often interpreted as an indicator of an athlete’s ability to utilize the stretch-shortening cycle. However, a higher EUR does not automatically mean better SSC function. It represents only one part of the overall picture and should therefore be interpreted with caution.
The final EUR value can be influenced not only by SSC-related qualities, but also by the athlete’s movement strategy, test execution and the quality of the Squat Jump itself (Kozinc et al., 2022). For example, differences in starting squat depth, greater knee flexion, or even slight pre-loading before take-off can change the nature of the SJ and influence the final result.
This is why differences between CMJ and SJ should never be interpreted from the final numbers alone. The way each test was performed matters just as much as the result itself.
Key CMJ Metrics: Where Should You Start?
Looking at the force-time curve itself is only one part of CMJ interpretation. A large amount of useful information also comes from the individual metrics calculated from the jump.
Jump Height is one of the most commonly monitored CMJ metrics and provides a simple measure of the final jump outcome. However, jump height represents only one part of the overall picture. On its own, it cannot explain how the athlete achieved that result, nor does it provide a complete picture of their current performance or readiness (Claudino et al., 2017).
The CMJ can provide a large number of metrics, but there is no need to monitor all of them at once. Metric selection should depend on the purpose of testing and on how deeply we want to analyse the jump.
For practical use, we apply a simple three-level framework to help coaches decide which CMJ metrics to start with and when it may be useful to move towards more advanced analysis.
CC Athletics Practical CMJ Framework
Level 1 — Basic Performance and Strategy
These metrics provide a basic overview of both the performance outcome and the way the jump was performed:
- Jump Height
- Relative Peak / Mean Power
- Contraction Time
- Countermovement Depth
For coaches who are new to force plates and CMJ analysis, these metrics provide a useful starting point. Together, they allow us to monitor not only the final outcome, but also the time and movement range the athlete used to achieve it.
Level 2 — Deeper Force-Time Analysis
The second level looks more closely at individual phases of the movement and helps us better understand how the athlete manages force throughout the CMJ:
- RSI-mod
- Propulsive Impulse
- Braking Impulse
- Peak Downward Velocity
These metrics allow us to examine the speed of the movement, how the athlete decelerates the downward motion, and how they subsequently generate the impulse required for take-off.
Level 3 — Advanced Interpretation
The third level includes metrics and analytical approaches that require a deeper understanding of both force-time data and CMJ execution:
- Phase-Specific Asymmetry
- Rate of Force Development (RFD)
- Force-Time Curve Morphology
RFD, for example, can be a very interesting metric, but its value and interpretation depend heavily on where in the movement it is measured and on how the jump itself was performed (Merrigan et al., 2020). Similarly, asymmetry and force-time curve morphology should not be interpreted in isolation without considering the surrounding metrics and context (Heishman et al., 2019).
If We Could Track Only Four Things
If we had to select only four areas for a basic CMJ analysis, we would focus on:
- Jump Height — what outcome did the athlete achieve?
- Relative Power — how much power did the athlete produce relative to body mass?
- Braking / Propulsive Impulse — how was force applied over time during the braking and propulsive phases?
- Force-Time Curve — how was the overall movement produced?
The force-time curve is not a single metric in itself, but its shape helps place the individual values into context and provides a clearer picture of how the athlete achieved the final result (Sole et al., 2018).
Output vs. Strategy: Same Result, Different Jump
The CMJ provides a large number of variables, but for practical interpretation it is useful to separate them into two broad perspectives: output and movement strategy. Put simply, we can ask two different questions: What did the athlete produce, and how did they produce it?
Two athletes can achieve a very similar outcome, such as the same jump height, while using different movement strategies to get there. This distinction can be important when profiling an athlete and when monitoring changes in performance over time. Analysing the complete force-time profile can reveal information that is not captured by the final outcome alone (Barker et al., 2018; Sole et al., 2018).
Output Metrics
Output metrics primarily describe the athlete’s performance outcome. Examples include:
- Jump Height
- Take-Off Velocity
- Propulsive Impulse
- Peak / Mean Power
These variables tell us what the athlete achieved during the jump.
Strategy Metrics and Force-Time Characteristics
Strategy-related metrics and force-time characteristics help us understand how that outcome was produced. These may include:
- countermovement duration,
- characteristics of the braking and propulsive phases,
- changes in movement velocity,
- contribution from each limb,
- and the overall morphology of the force-time curve.
It is the combination of these two perspectives that gives us a more complete interpretation of the CMJ.
The same output does not necessarily mean the same movement strategy.
Practical Example
The figure below shows the force-time curves of two athletes who both achieved a jump height of 41.2 cm. From the perspective of jump height, their performance outcome is identical. However, the shape of their force-time profiles is clearly different.
Athlete A — the upper graph demonstrates a more pronounced bimodal pattern during the propulsive portion of the force-time curve. In practical terms, this means that two distinct force peaks are visible during the propulsive phase rather than one dominant peak.
This type of curve may represent a different movement strategy, but it should not be interpreted in isolation. Its meaning should be considered alongside other force-time variables and, where available, kinematic data. Athlete A also demonstrates very low inter-limb asymmetry during the propulsive phase, at just 0.8%.
Athlete B — despite achieving the same jump height, the athlete demonstrates a different propulsive force-time profile and a shorter propulsive phase. Athlete B also shows greater asymmetry between the left and right lower limbs.
This example illustrates a simple but important principle:
Both athletes achieved the same jump height, but they did not achieve it in the same way.
That is why CMJ analysis should not focus solely on the final output. We should also consider the movement strategy that sits behind it.
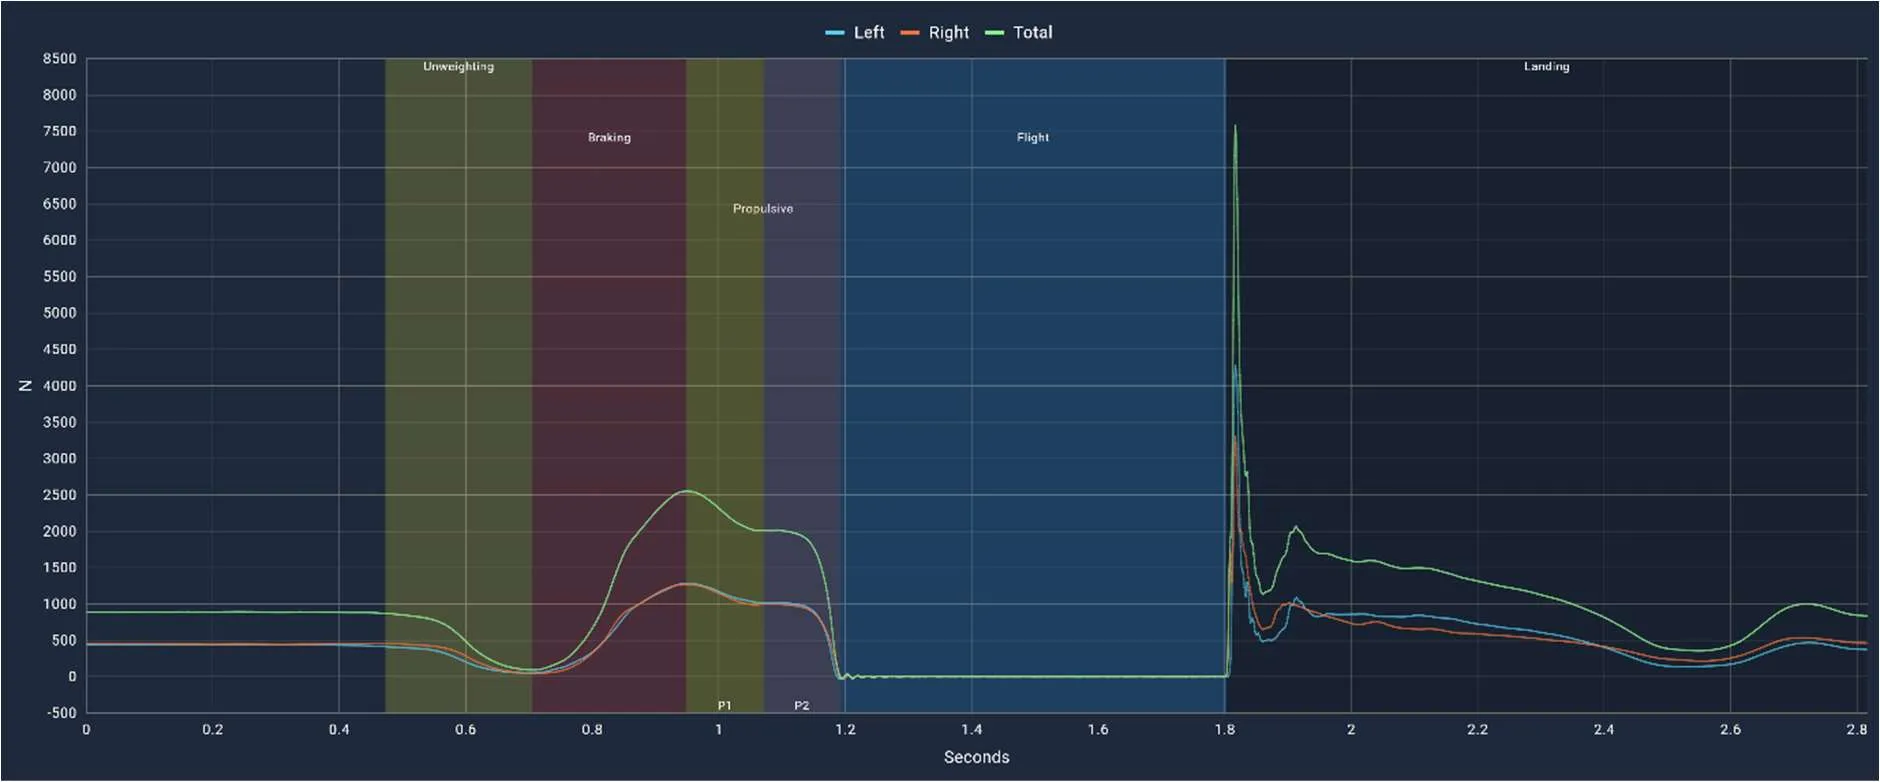
Athlete A
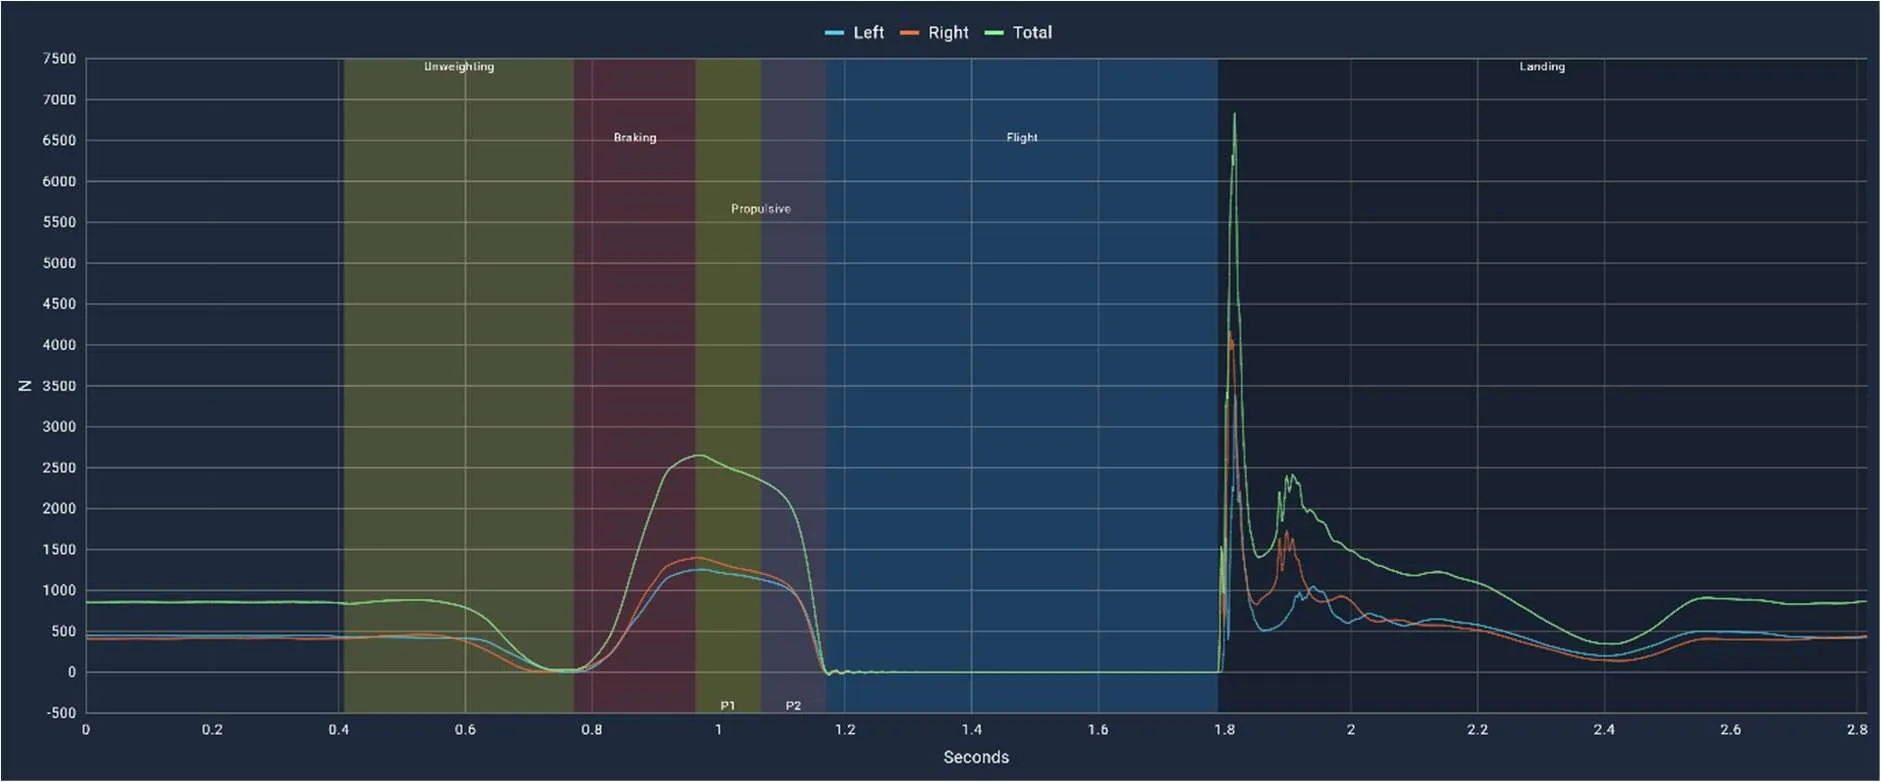
Athlete B
Figure 2. Force-time profiles of two athletes who both achieved a 41.2 cm CMJ. Despite identical jump height, their force-time profiles demonstrate different movement strategies. Source: CC Athletics testing data.
How Do We Know if a Change Is Real?
When monitoring CMJ performance over time, simply comparing two values is not enough to determine whether an athlete has truly improved or declined. Every test contains a certain degree of natural variability, and different CMJ metrics also differ in their reliability. Therefore, a small change between two testing sessions does not automatically represent a meaningful change in performance (Cormack et al., 2008; Merrigan et al., 2020).
Consider a simple hypothetical example.
An athlete improves their Jump Height from 40.0 cm to 40.7 cm, an increase of approximately 1.7%.
Now assume that the typical test-to-test variability for Jump Height in this particular athlete or group is approximately 3%. In that case, we should be cautious about interpreting the 1.7% improvement as a meaningful adaptation, because the change may still fall within the normal variability of the measurement.
The 3% value is used here only as an illustrative example. Actual variability can differ depending on the athlete, population, testing protocol and metric being analysed.
This does not mean that the athlete definitely did not improve. It simply means that one small change is not enough to confidently conclude that a true adaptation has occurred.
Coefficient of Variation — CV
One practical way to quantify test variability is the Coefficient of Variation (CV).
CV expresses the typical variability of a measurement relative to its mean value and is usually reported as a percentage. Put simply, it helps us answer the question:
“How much does this metric normally fluctuate in this athlete or group when we do not expect a true change in performance?”
This is particularly important because not all CMJ metrics are equally reliable. Variables such as Jump Height generally demonstrate very good reliability, while some more complex force-time characteristics can show considerably greater variability (Merrigan et al., 2020).
A 3% change in Jump Height, for example, should not automatically be interpreted in the same way as a 3% change in RFD or another variable with greater typical variability.
Athlete Baseline
For practical monitoring, understanding the athlete’s individual baseline becomes even more important.
The more high-quality, standardized tests we collect from an athlete, the better we can understand what their normal performance looks like and how much their results typically fluctuate.
Instead of comparing every new result only with a team average or population norm, we can therefore compare the athlete primarily with their own historical data.
Consider another hypothetical example.
Athlete A
Typical Jump Height: 39.5–40.5 cm New result: 40.2 cm
The result still falls within the athlete’s usual range.
Athlete B
Typical Jump Height: 39.5–40.5 cm New result: 42.0 cm
In this case, there is much more reason to pay attention to the change.
These values are not intended to represent universal norms or thresholds. They simply illustrate why knowing an athlete’s individual baseline is important when interpreting changes in performance.
This is why repeated measures and an individual athlete baseline are so valuable in longitudinal monitoring.
A single test gives us a result. A series of standardized tests gives us context.
Smallest Worthwhile Change — SWC
Another concept commonly used when evaluating changes in performance is the Smallest Worthwhile Change (SWC).
The purpose of SWC is to estimate the magnitude of change that may be considered practically meaningful.
However, SWC should not be treated as a universal cut-off that automatically separates every result into “improved” or “no change.” Its interpretation depends on the method used to calculate it, the population being assessed, the metric being monitored and the typical variability of that metric.
For this reason, SWC is better interpreted alongside information about measurement reliability and typical variation, rather than being used as an isolated decision rule (Hopkins et al., 2009; Nibali et al., 2015).
One Result Is Not Enough
The CMJ can be a valuable tool for monitoring neuromuscular status, but its greatest value comes from repeated and standardized testing (Claudino et al., 2017).
If one metric decreases slightly during a single testing session, it does not automatically mean that the athlete is fatigued. Similarly, a small increase in Jump Height does not automatically represent a positive training adaptation.
Instead of focusing on one isolated number, we should ask:
- Is the change greater than the normal variability of this metric?
- Is the change consistent across subsequent tests?
- Have other related metrics changed as well?
- Has the athlete’s movement strategy changed?
- Does the result make sense in the context of the athlete’s current training load and overall status?
Combining these pieces of information provides a much stronger basis for decision-making than simply comparing PRE and POST values.
Not every change in a number represents a change in the athlete. Before interpreting the result, we first need to understand how unusual that change actually is for that metric and that athlete.
Practical Recommendations for CMJ Testing
Most of this article comes down to one habit: pick a protocol and a small set of metrics, and keep both the same over time. One practical approach is to test athletes once per week using three maximal CMJs, with the hands on the hips and a self-selected countermovement depth, tracking the same key metrics each session so an individual baseline can build up.
In practice, CMJ monitoring can therefore be built around a few simple principles:
- Test consistently — use the same device, protocol and testing conditions.
- Focus on long-term trends, not a single isolated result.
- Track the same key metrics over time so results remain comparable.
- Compare athletes primarily with their own baseline.
- Do not interpret one metric in isolation — Jump Height, asymmetry and RFD all require broader context.
- Separate output from movement strategy — the same result does not necessarily mean the same way of producing it.
CMJ testing does not need to be complicated.
The value of the data does not come from monitoring as many metrics as possible. It comes from repeatedly and consistently measuring a small number of relevant variables and interpreting them within the context of the individual athlete.
Want to run this kind of analysis on your own athletes? The PlateMate dual force plates capture the full force-time curve of every jump in ForceMate. Get in touch with the CC Athletics team.
References
Barker, L. A., Harry, J. R., & Mercer, J. A. (2018). Relationships between countermovement jump ground reaction forces and jump height, reactive strength index, and jump time. Journal of Strength and Conditioning Research, 32(1), 248–254. doi: 10.1519/JSC.0000000000002160.
Claudino, J. G., Cronin, J., Mezêncio, B., McMaster, D. T., McGuigan, M., Tricoli, V., Amadio, A. C., & Serrão, J. C. (2017). The countermovement jump to monitor neuromuscular status: A meta-analysis. Journal of Science and Medicine in Sport, 20(4), 397–402. doi: 10.1016/j.jsams.2016.08.011.
Cormack, S. J., Newton, R. U., McGuigan, M. R., & Doyle, T. L. A. (2008). Reliability of measures obtained during single and repeated countermovement jumps. International Journal of Sports Physiology and Performance, 3(2), 131–144. doi: 10.1123/ijspp.3.2.131.
Heishman, A. D., Curtis, M. A., Saliba, E. N., Hornett, R. J., Malin, S. K., & Weltman, A. L. (2017). Comparing performance during morning vs. afternoon training sessions in intercollegiate basketball players. Journal of Strength and Conditioning Research, 31(6), 1557–1562. doi: 10.1519/JSC.0000000000001882.
Heishman, A., Daub, B., Miller, R., Brown, B., Freitas, E., & Bemben, M. (2019). Countermovement jump inter-limb asymmetries in collegiate basketball players. Sports, 7(5), 103. doi: 10.3390/sports7050103.
Heishman, A. D., Daub, B. D., Miller, R. M., Freitas, E. D. S., Frantz, B. A., & Bemben, M. G. (2020). Countermovement jump reliability performed with and without an arm swing in NCAA Division 1 intercollegiate basketball players. Journal of Strength and Conditioning Research, 34(2), 546–558. doi: 10.1519/JSC.0000000000002812.
Hopkins, W. G., Marshall, S. W., Batterham, A. M., & Hanin, J. (2009). Progressive statistics for studies in sports medicine and exercise science. Medicine & Science in Sports & Exercise, 41(1), 3–13. doi: 10.1249/MSS.0b013e31818cb278.
Howarth, D. J., Cohen, D. D., McLean, B. D., & Coutts, A. J. (2022). Establishing the noise: Interday ecological reliability of countermovement jump variables in professional rugby union players. Journal of Strength and Conditioning Research, 36(11), 3159–3166. doi: 10.1519/JSC.0000000000004037.
Kotsifaki, R., Sideris, V., King, E., Bahr, R., & Whiteley, R. (2023). Performance and symmetry measures during vertical jump testing at return to sport after ACL reconstruction. British Journal of Sports Medicine, 57(20), 1304–1310. doi: 10.1136/bjsports-2022-106588.
Kozinc, Ž., Žitnik, J., Smajla, D., & Šarabon, N. (2022). The difference between squat jump and countermovement jump in 770 male and female participants from different sports. European Journal of Sport Science, 22(7), 985–993. doi: 10.1080/17461391.2021.1936654.
Markovic, G., Dizdar, D., Jukic, I., & Cardinale, M. (2004). Reliability and factorial validity of squat and countermovement jump tests. Journal of Strength and Conditioning Research, 18(3), 551–555. doi: 10.1519/1533-4287(2004)18<551:RAFVOS>2.0.CO;2.
McHugh, M. P., Cohen, J. A., Orishimo, K. F., & Kremenic, I. J. (2024). Effect of countermovement depth on the neuromechanics of a vertical jump. Translational Sports Medicine, 2024, 7113900. doi: 10.1155/2024/7113900.
Merrigan, J. J., Stone, J. D., Hornsby, W. G., & Hagen, J. A. (2020). Identifying reliable and relatable force-time metrics in athletes—Considerations for the isometric mid-thigh pull and countermovement jump. Sports, 9(1), 4. doi: 10.3390/sports9010004.
Nibali, M. L., Tombleson, T., Brady, P. H., & Wagner, P. (2015). Influence of familiarization and competitive level on the reliability of countermovement vertical jump kinetic and kinematic variables. Journal of Strength and Conditioning Research, 29(10), 2827–2835. doi: 10.1519/JSC.0000000000000964.
Rago, V., Brito, J., Figueiredo, P., Carvalho, T., Fernandes, T., Fonseca, P., & Rebelo, A. (2018). Countermovement jump analysis using different portable devices: Implications for field testing. Sports, 6(3), 91. doi: 10.3390/sports6030091.
Sánchez-Sixto, A., Harrison, A. J., & Floría, P. (2018). Larger countermovement increases the jump height of countermovement jump. Sports, 6(4), 131. doi: 10.3390/sports6040131.
Sole, C. J., Mizuguchi, S., Sato, K., Moir, G. L., & Stone, M. H. (2018). Phase characteristics of the countermovement jump force-time curve: A comparison of athletes by jumping ability. Journal of Strength and Conditioning Research, 32(4), 1155–1165. doi: 10.1519/JSC.0000000000001945.
Van Hooren, B., & Zolotarjova, J. (2017). The difference between countermovement and squat jump performances: A review of underlying mechanisms with practical applications. Journal of Strength and Conditioning Research, 31(7), 2011–2020. doi: 10.1519/JSC.0000000000001913.
Frequently asked questions
What is the eccentric utilization ratio (EUR)?
EUR is countermovement jump height divided by squat jump height. It is often read as a measure of how well an athlete uses the stretch-shortening cycle, but movement strategy and test execution influence it too, so a higher EUR does not automatically mean better SSC function.
What is the difference between output and strategy metrics in a CMJ?
Output metrics describe what the athlete produced: jump height, take-off velocity, impulse, power. Strategy metrics describe how they produced it: countermovement depth, phase durations, movement velocity and each limb's contribution. Two athletes can reach the same jump height with very different strategies.
How do you know if a change in CMJ performance is real?
Compare the change against the metric's typical test-to-test variability and the athlete's own baseline. A change that falls within normal fluctuation is not evidence of a true adaptation; look for changes that exceed typical variability and stay consistent across repeated tests.
Which CMJ metrics should you track first?
Start with jump height, relative peak or mean power, contraction time and countermovement depth. Together they cover both the outcome and the way the jump was performed. Add impulse measures and RSI-mod once you are comfortable reading the force-time curve.
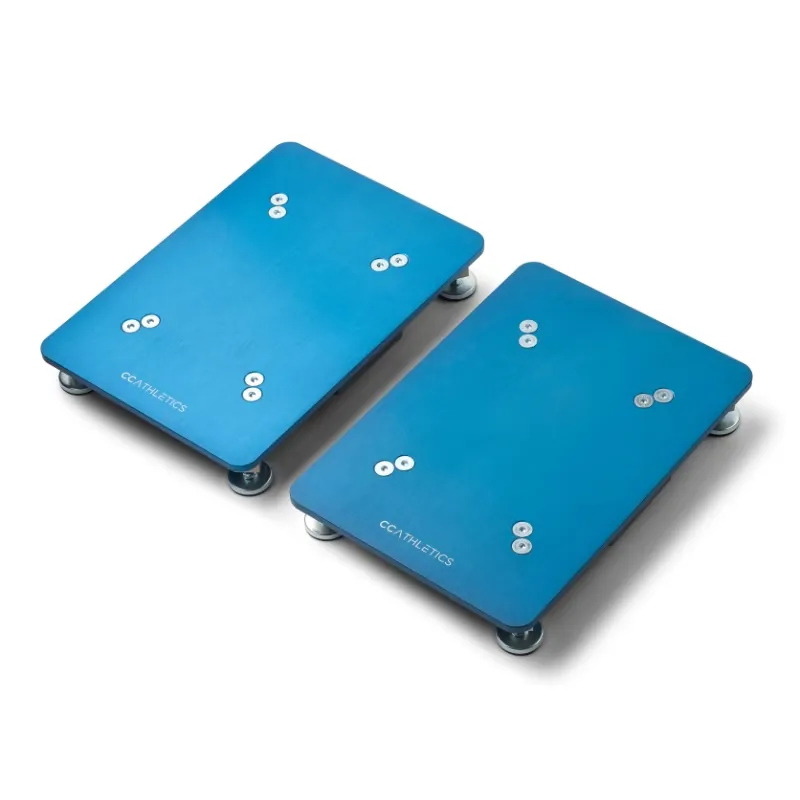
The product behind this article
PlateMate
Dual force plates with 4 000 kg max load and externally validated precision.
Explore PlateMate →