


Featured case — Rua Laboratories
The 20% no one could see.
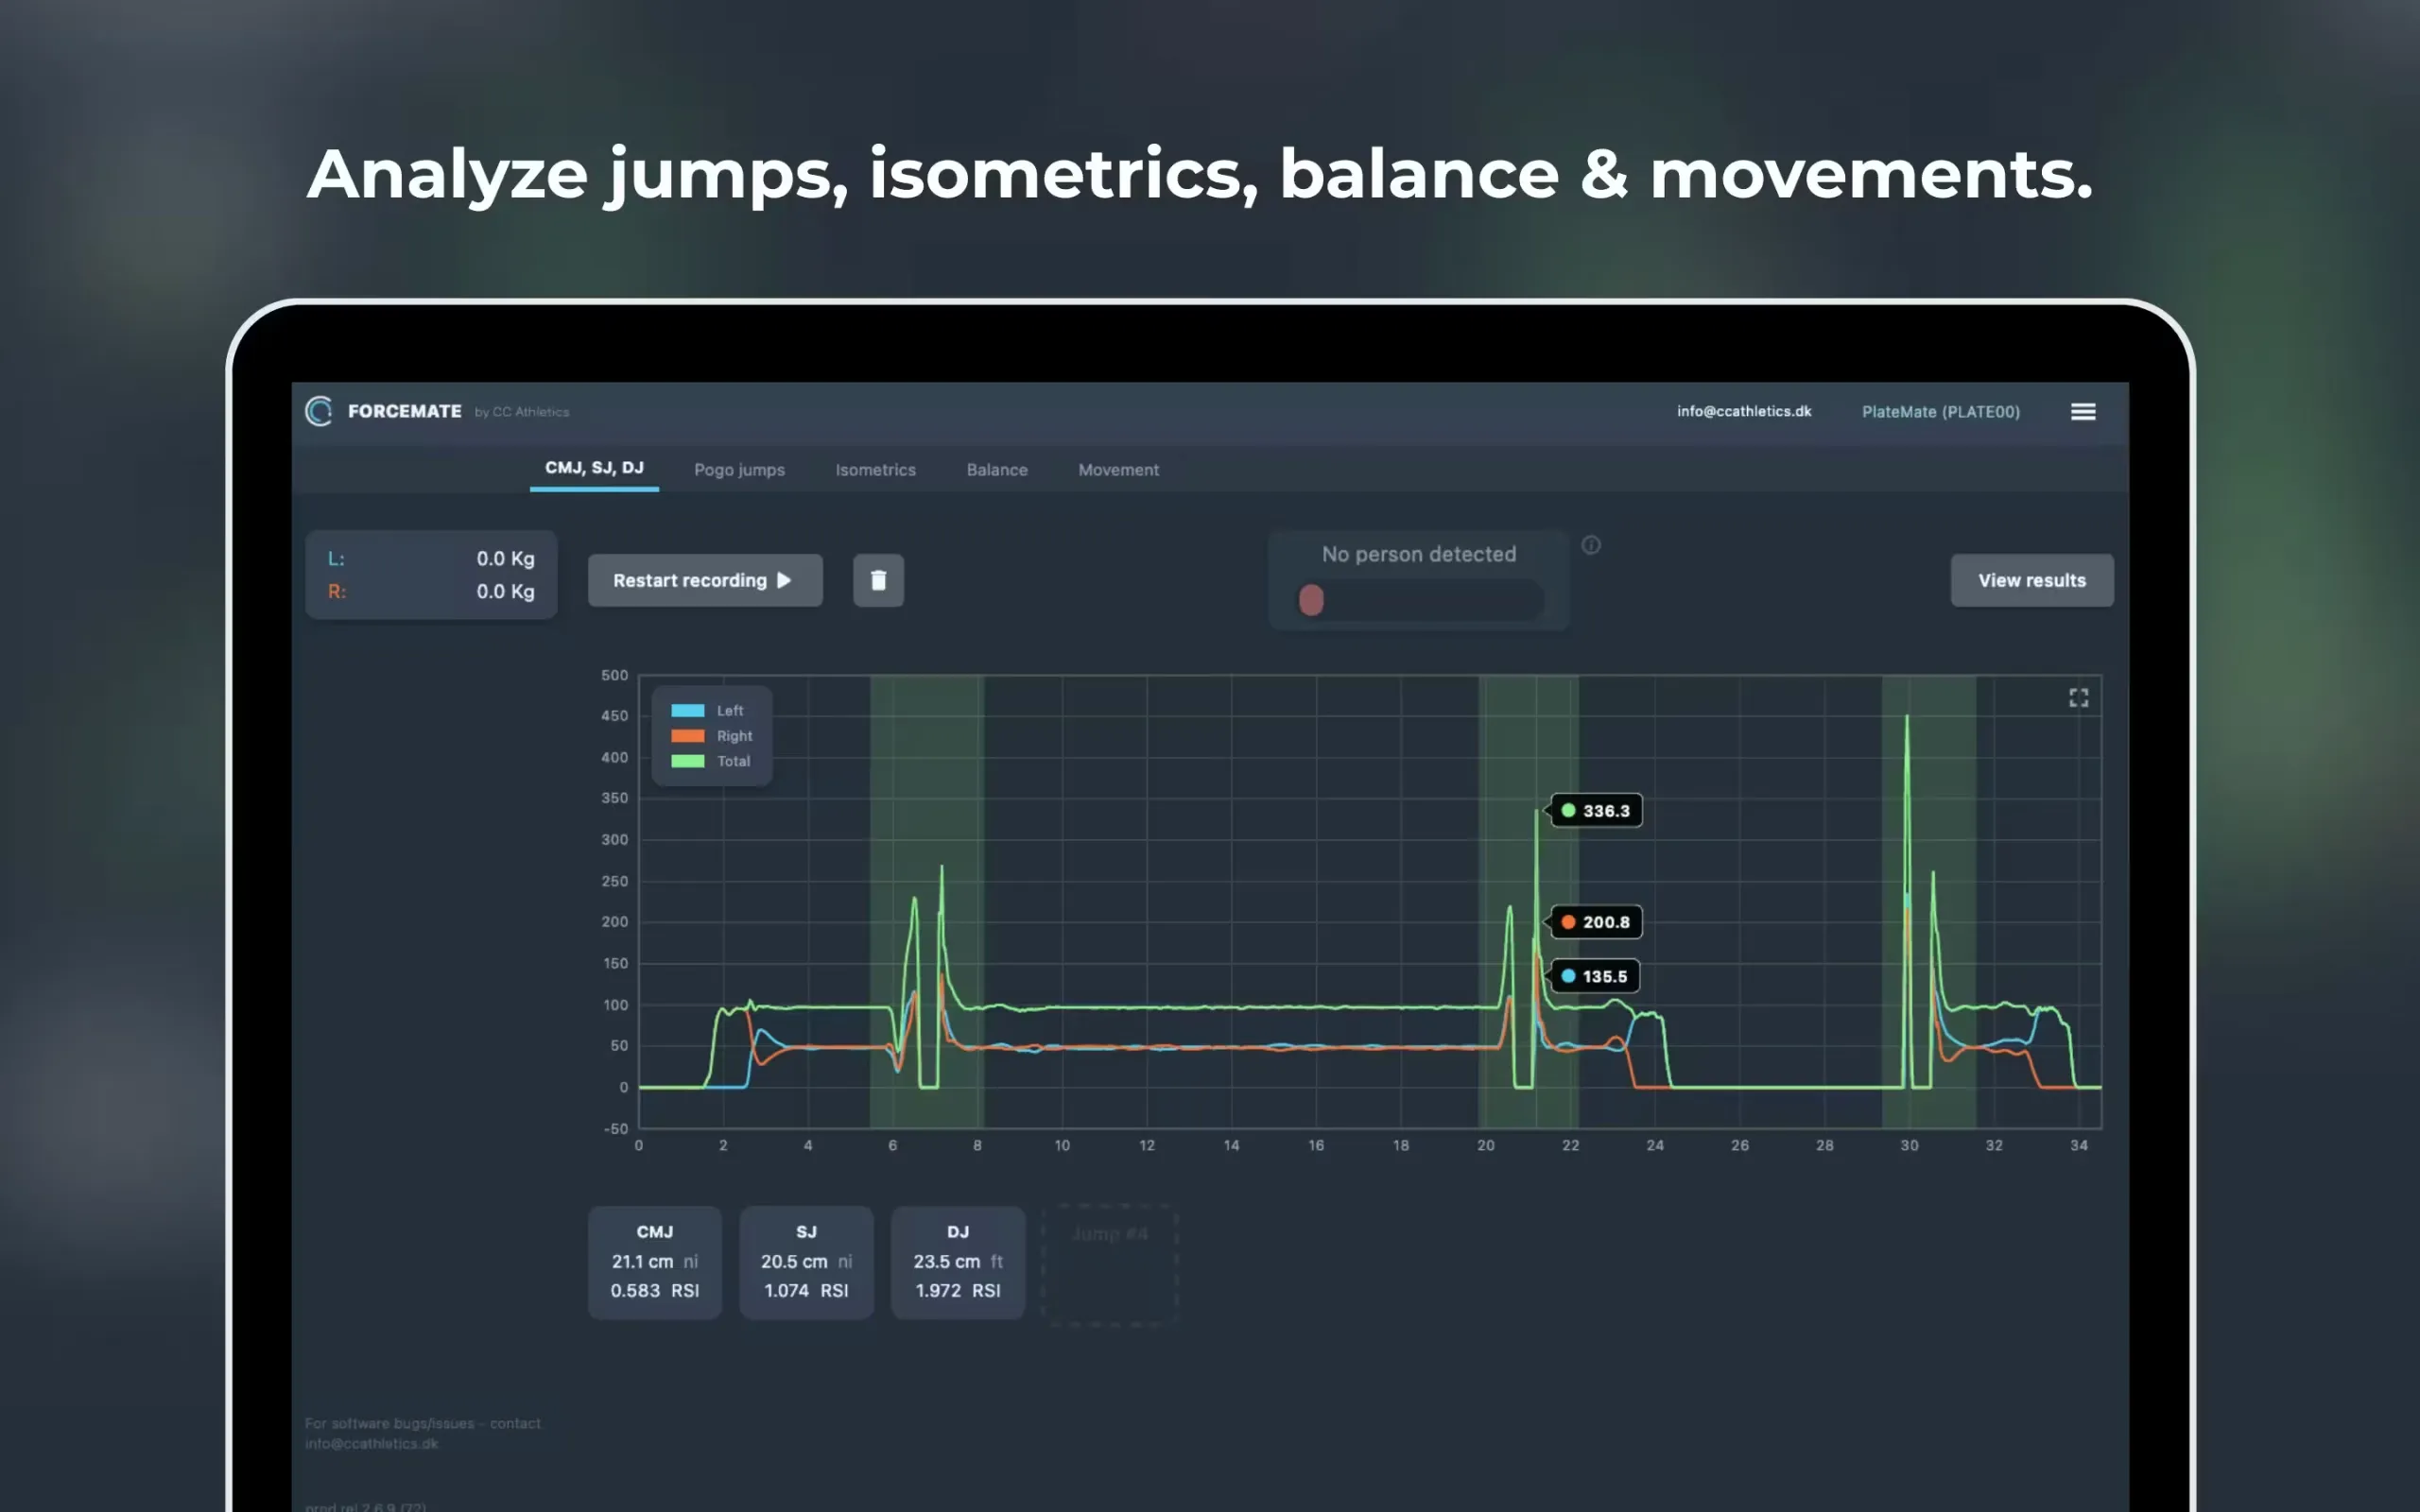
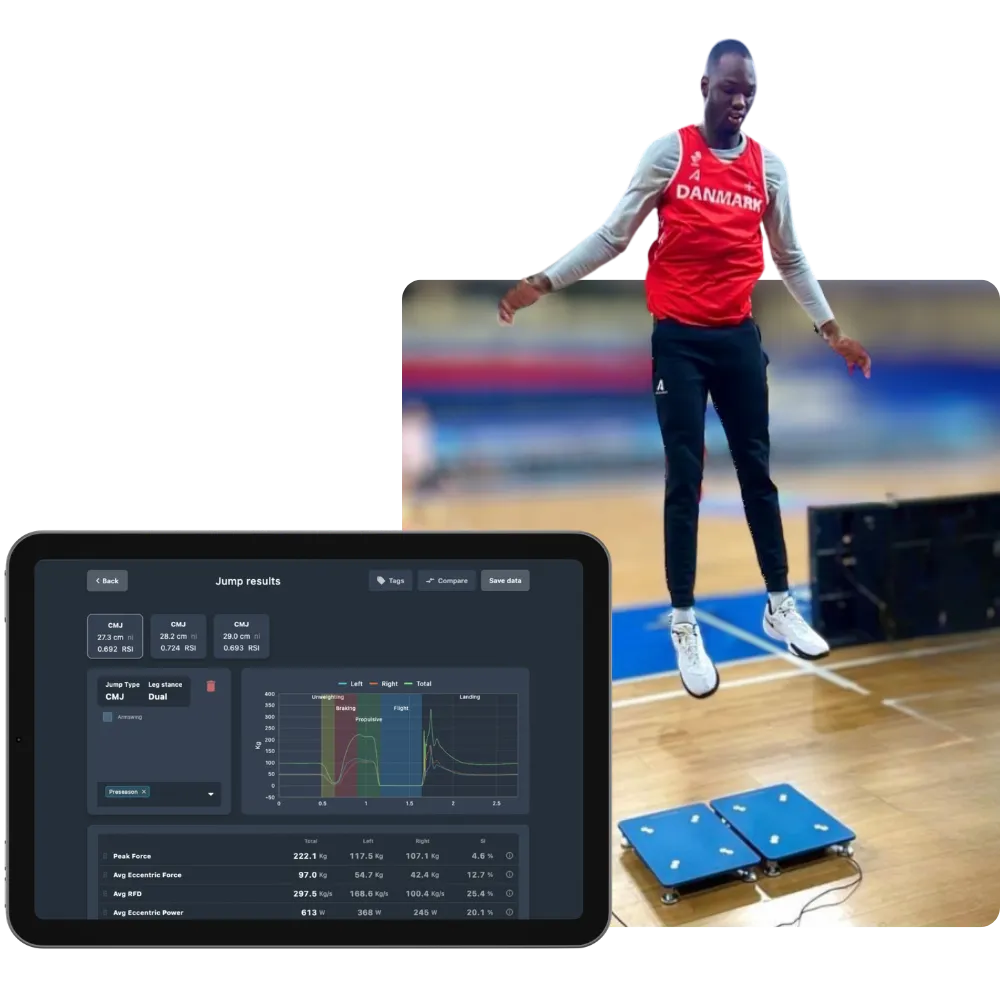
An ACL athlete seven months post-op looked perfectly symmetrical on video. The plates didn't agree.
“On landing, peak force asymmetry hit 20% on initial contact — for a split second. We'd never have caught it without the plates. It showed the athlete wasn't ready to return.”
Jack Rua Laboratories · June 2026