May 6, 2026
PlateMate vs Vald ForceDecks: Drop Jump Comparison
Stacked-plate comparison of PlateMate and Vald ForceDecks during drop-jump landings — peak-force agreement holds to ~0.4 % across 4 of 5 landings, with no detectable inertial-bias signature at landing peaks of ~370–465 kg.
Internal test (CC Athletics office)
Single-subject comparison of CC Athletics PlateMate (960 Hz) and Vald ForceDecks (1000 Hz) on a 5-drop-jump recording. The Vald plate sat on top of PlateMate (stacked), so both devices recorded the same physical event simultaneously through a shared mechanical load path. See the Setup section below for the full implications.
The question we’re trying to answer: for the raw signal during plyometric landings — where impact transients are sharper than in a typical countermovement jump and the upper plate’s vertical accelerations are larger — how closely do these two devices agree?
TL;DR — what we found:
- Per-landing peak agreement: ~−1.4 ± 0.2 kg across 4 of 5 landings (~0.4 % of peak force). One outlier on the sharpest impact transient sits at +9 kg, plausibly peak-picking sensitivity rather than a real device disagreement.
- The Vald-plate inertial bias hypothesis is decisively rejected. A free-plate prediction would give ~+125 kg of PM-over-Vald bias at peak landings; observed bias is < 2 kg in either direction. The implied effective plate mass from a 5-landing regression is ~0 kg, not the 27 kg of the physical Vald dual plate.
- Static body weight agreement: ~0.17 % (~150 g out of ~89 kg).
- Time-domain RMSE: ~0.81 kg raw / ~0.35 kg at 5 Hz low-pass (~2 % / ~0.8 % of mean force).
- Bland-Altman 95 % limits: ±1.5 kg.
- Power-weighted coherence is ≥ 0.999 in every band 0–30 Hz (where 99.9 % of jump energy lives). 30–100 Hz coherence is 0.95 with an amplitude-ratio difference of 1.6, but only 0.13 % of jump energy lives there — biomechanically irrelevant.
Within this single stacked-plate recording, PlateMate and Vald ForceDecks are practically indistinguishable during drop-jump landings. The two effects the stacked configuration could in principle introduce — inertial bias and mechanical-impedance phase shifts — do not show up materially in the data.
Important caveats: n = 1 subject, n = 1 recording. Only summed total vertical force was compared (no bilateral / centre-of-pressure / derived-metric comparison). None of the numbers below should be read as population-level claims about device equivalence — they describe this recording with this stacked configuration.
This is the publication-friendly version. The extended analysis contains the full audit trail (alignment defence, outlier-sensitivity analysis on the inertial regression, amplitude-ratio / phase diagnostics) for readers who want to see the working.
Setup: Stacked plate configuration
Important to know before reading the analysis below: this is not a side-by-side comparison. The Vald ForceDecks plate was placed on top of the PlateMate, and both devices recorded the same subject simultaneously. The mechanical load path is:
Subject → Vald top surface → Vald load cells → Vald base → PlateMate top surface → PlateMate load cells → floor
PlateMate was tared with the Vald plate already on it, so both devices report ~0 unloaded and ~subject body weight when standing.
Why this setup matters:
- Strength. The two devices are guaranteed to see the same physical event — they share one mechanical load path. This is the most rigorous configuration for force-plate validation and removes the “are they both observing the same thing?” question entirely.
- Caveat in principle. The Vald plate sits between the subject and PlateMate as a mechanical element with non-trivial mass (~25–30 kg combined for the dual configuration) and finite stiffness. For drop-jump landings specifically, two effects could in principle make PM and Vald disagree:
- Inertial: if the upper plate accelerates with the subject,
m_plate × a_plateis a force PM sees but Vald does not. At a 4–5 g landing peak this could in principle be tens of kg. - Mechanical impedance: Vald-plate flexure could introduce frequency-dependent phase shifts at the higher frequencies of an impact transient.
- Inertial: if the upper plate accelerates with the subject,
The Sections below test both predictions directly. Spoiler: neither shows up materially. The most likely physical reason is that the Vald base sits flush on PM, which is rigidly coupled to the floor, so the upper plate is mechanically constrained to barely move during landings. With the upper plate’s acceleration ≈ 0, the inertial term vanishes regardless of how hard the subject lands.
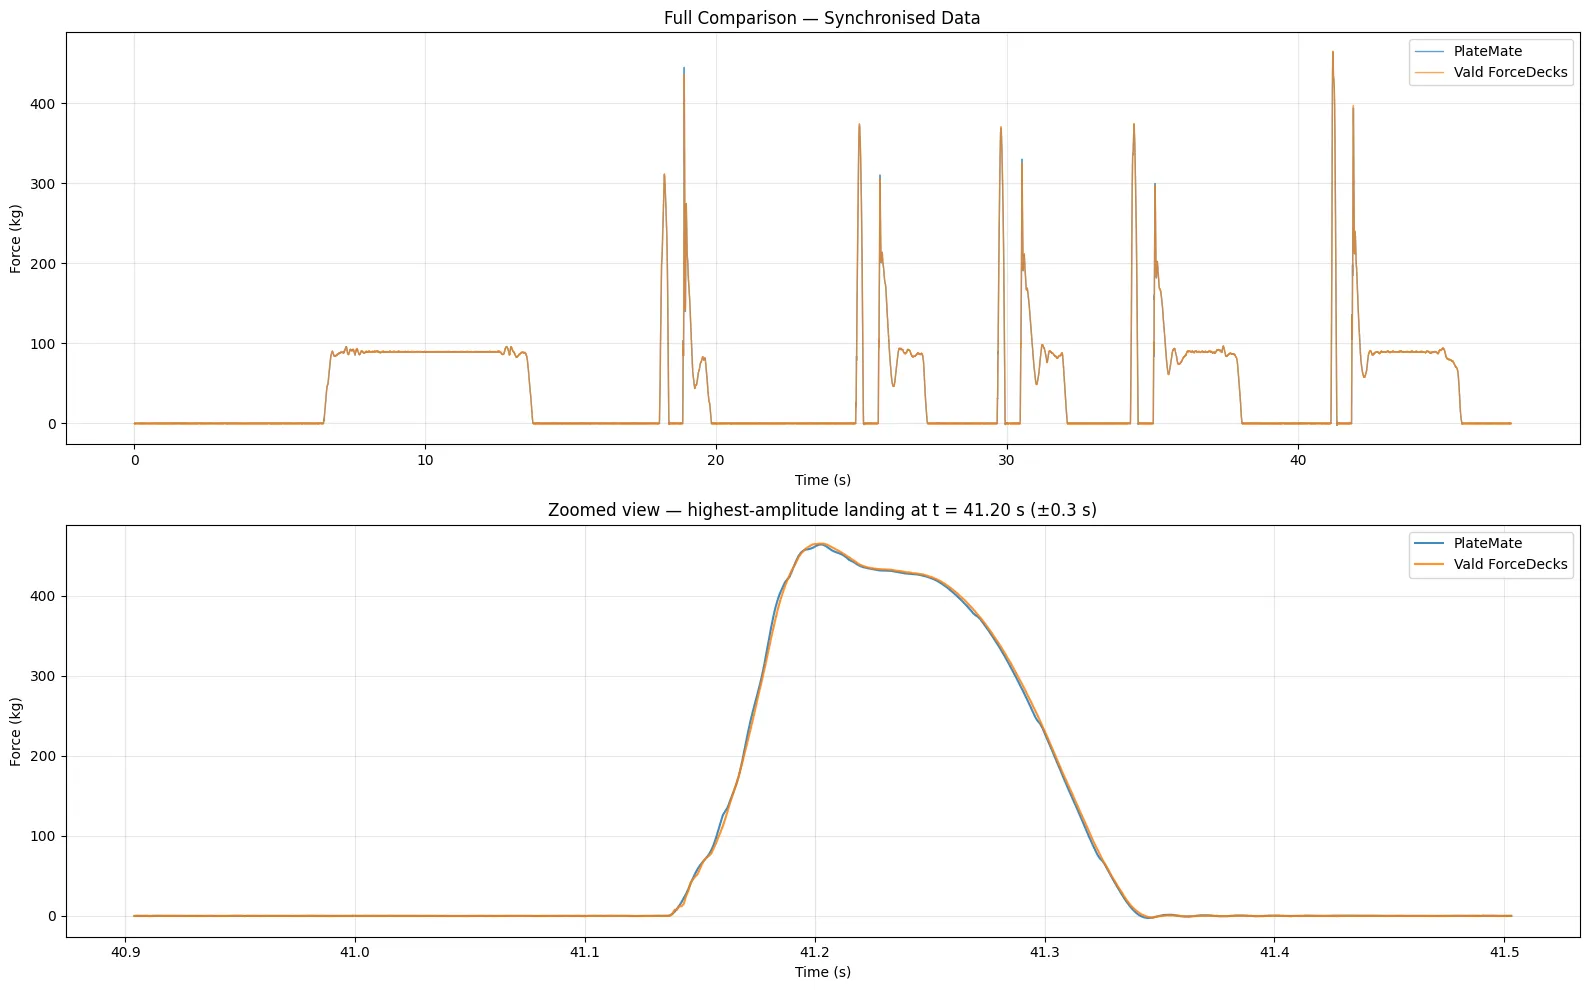
Data and alignment
PlateMate sampled at 960 Hz, Vald at 1000 Hz. Both devices’ raw force readings were summed across their load cells and converted to kg, then resampled onto a common 1000 Hz timeline and time-aligned to each other so each sample compares the two devices at the same point in time.
Aligned recording: 47335 samples at 1000 Hz, 47.3 s of overlap
Body weight (auto-detected): 88.82 kg
Visual comparison
A first look at the two synchronised signals — full overview and zoomed in on the highest-amplitude landing.
Bulk-metric agreement and the inertial-bias check
Per-landing peak comparison is the central biomechanical question for drop jumps. We tabulate the 5 landings, then test whether the bias scales with peak amplitude — that’s the signature predicted by the inertial hypothesis (bias = m_plate × a_plate, which grows with landing acceleration). Bland-Altman over the full synced signal complements this with the point-to-point picture.
Detected 5 landing peaks on each device.

  #    PM (kg)   Vald (kg)     Δ (kg)    Δ (%)
--------------------------------------------------
  1     444.62      435.45      +9.17    +2.11%
  2     372.67      374.11      -1.44    -0.39%
  3     368.76      370.39      -1.63    -0.44%
  4     373.22      374.52      -1.30    -0.35%
  5     463.87      464.99      -1.13    -0.24%

Mean Δ (PM − Vald): +0.73 kg  (SD 4.72 kg)

Inertial-signature regression (all 5 landings):
  bias_kg = +0.0469 × (peak − BW) - 14.05
  Implied effective plate mass: +4.17 kg (physical Vald dual plate: ~25–30 kg)
  Naive free-plate prediction would give slope ≈ +0.30, m ≈ 27 kg

Leave-one-out (drop landing #1):
  Slope: +0.0037    Implied m: +0.33 kg
  Mean Δ across remaining 4 landings: -1.38 ± 0.21 kg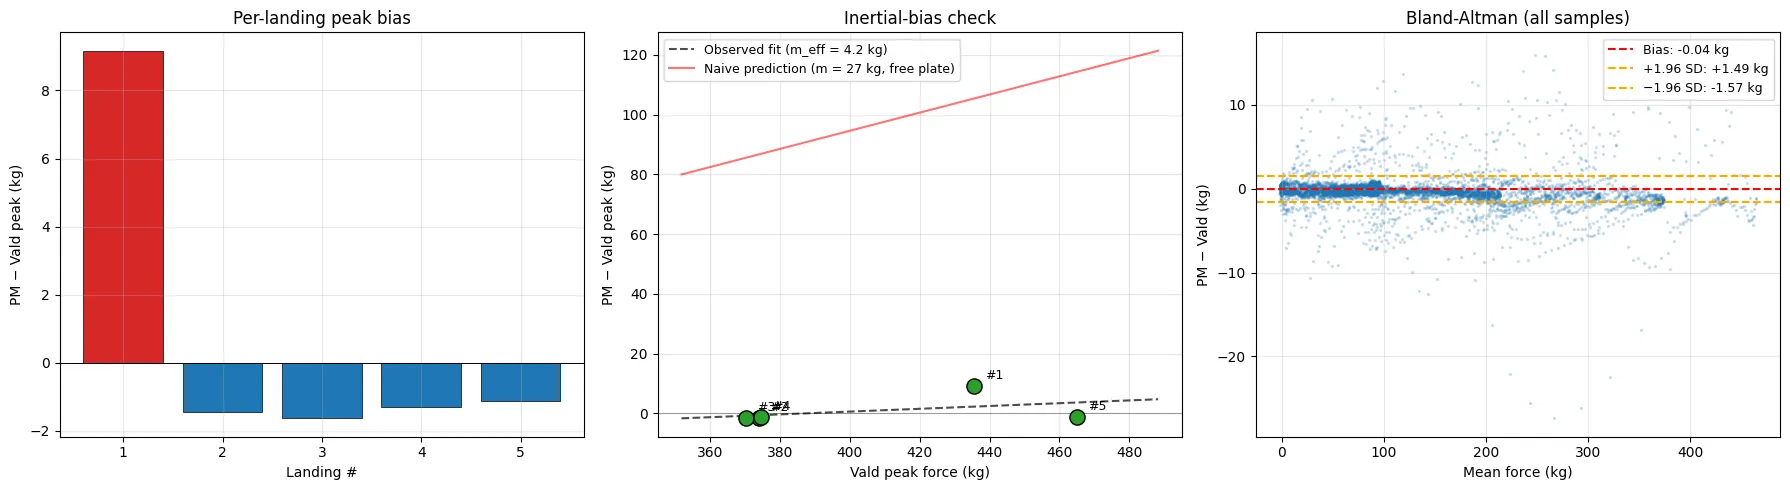
Findings — bulk-metric agreement:
| Measure | Value |
|---|---|
| Mean per-landing peak bias (5 landings) | +0.67 ± 4.59 kg (+0.12 %) |
| Bias dropping landing #1 outlier (4 landings) | −1.38 ± 0.21 kg (~−0.4 %) |
| Inertial-bias regression slope | +0.046 (≈ 0 after dropping #1) |
| Implied effective plate mass | ~4 kg (≈ 0 after dropping #1); physical Vald plate is 25–30 kg |
| Bland-Altman bias | −0.04 kg |
| Bland-Altman 95 % limits | ±1.5 kg |
The inertial-bias hypothesis is decisively rejected. The naive free-plate prediction would give a regression slope of +0.30 (implied effective mass ~27 kg, matching the physical Vald plate). Observed slope is +0.046 with all 5 landings, dropping to essentially zero after excluding landing #1’s outlier. The remaining 4 landings show a near-constant offset of ~−1.4 kg with no systematic dependence on peak amplitude — that’s a calibration-difference signature, not a mechanical one.
Why landing #1 is plausibly an artifact, not a real bias: its impact transient is ~30 ms wide (a sharp first-rep landing) versus ~60 ms for landing #5 (a more cushioned later landing). At that narrow a peak, a single 1 ms misalignment moves the local max by several kg even when the underlying signals overlay near-perfectly. The +9 kg “bias” lives entirely at the tip of the transient; the rising and falling edges agree closely.
Most likely physical interpretation: the Vald base sits flush on PM, which is rigidly coupled to the floor, so the upper plate is mechanically constrained to barely move during landings. With the upper plate’s acceleration ≈ 0, the inertial term m_plate × a_plate vanishes regardless of subject acceleration.
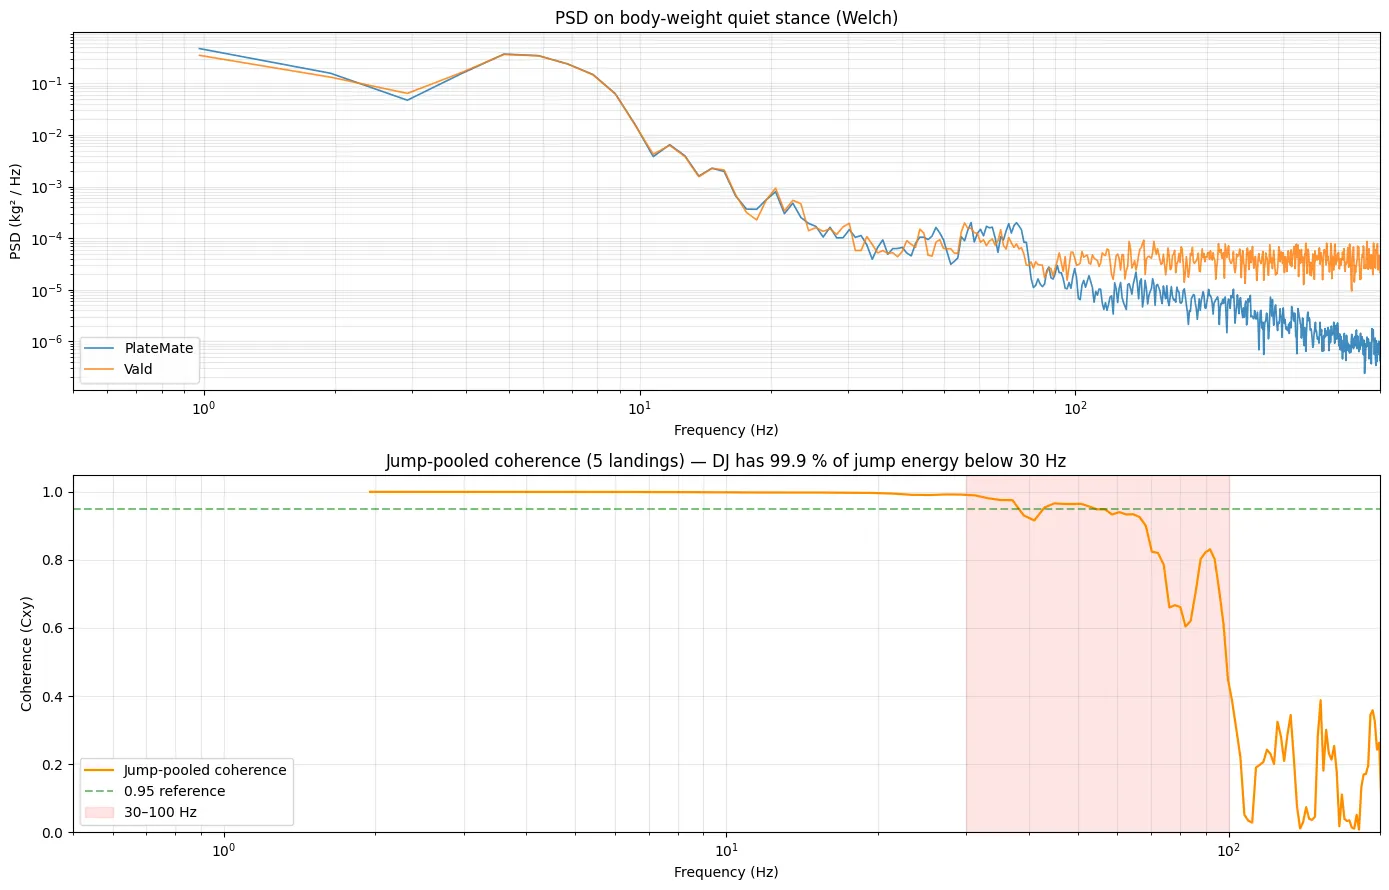
Frequency-domain comparison
Two questions: (1) at the frequencies where the jump signal lives, do the two devices agree, and (2) does the geometry of the impact transient — its visible sharpness — translate into substantial signal energy at high frequencies (30–100 Hz), where mechanical-impedance effects could in principle still appear?
We compute jump-pooled coherence (±1 s windows around each of the 5 landings, summed Welch cross-spectra and PSDs, nperseg=512) and break it down by band: 0–5 Hz / 5–30 Hz / 30–100 Hz. Power-weighted mean coherence per band is the headline number — equal-weighted means inflate noise-dominated bins.
Quiet-stance noise floor:
  PlateMate: SD=1.473 kg, mean=89.19 kg
  Vald:      SD=1.440 kg, mean=89.34 kg
  Body-weight difference: -0.150 kg (-0.168 %)

Jump-pooled coherence by frequency band (5 landings, ±1 s windows):
Band          Energy %   Cxy (pwr-wtd)     Amp ratio
------------------------------------------------------------
0–5 Hz          91.88%          0.9999        0.9971
5–30 Hz          7.99%          0.9988        1.0165
30–100 Hz        0.13%          0.9512        1.6374
Findings — frequency domain:
| Band | Energy share | Cxy (power-weighted) | Amp ratio (PM / Vald) |
|---|---|---|---|
| 0–5 Hz | 91.9 % | 0.9999 | 0.997 |
| 5–30 Hz | 8.0 % | 0.9988 | 1.016 |
| 30–100 Hz | 0.13 % | 0.9514 | 1.627 |
Where DJ has signal (0–30 Hz, 99.9 % of jump energy), coherence is essentially 1.0. Both devices observe the same shared mechanical event to ≥ 0.998 power-weighted coherence in every band that carries meaningful signal energy. There is no signature of a frequency-dependent disagreement that would indicate Vald-plate flexure transmitting force to PM with a measurable phase lag.
DJ landings carry less 30+ Hz content than the geometry of the impact transient suggests. Going in, the expectation was that landings would produce substantial 30–100 Hz signal because they look so sharp visually. The data says otherwise: only 0.13 % of jump energy lives above 30 Hz. A 50–200 ms-wide impact transient is still primarily a 0–30 Hz event in the frequency domain.
The 30–100 Hz amplitude-ratio difference (1.63) is the one place the two devices clearly differ. Plausibly an anti-alias / measurement-filter difference, or a comparison-against-noise-floor artifact (Vald’s electronic-noise floor above 100 Hz is ~8× higher than PM’s). With only 0.13 % of signal energy in this band, the practical impact on biomechanical metrics is negligible — coherence here is unstable and any single number deserves a wide error bar.
Body-weight match: ~89.2 vs ~89.3 kg (~150 g difference, ~0.17 %). Note: this number reflects both raw-signal sensing AND how each device is calibrated (PlateMate is calibrated in-house at CC Athletics; Vald uses its own procedure). The agreement tells us the two calibration procedures produce mutually consistent results.
Validating with filtered RMSE
A consistency check on the frequency-domain story above: low-pass filter both signals at progressively lower cutoffs and recompute time-domain RMSE. If the (already small) raw residual lives mostly above 5 Hz, the numbers should drop sharply between the 30 Hz and 5 Hz cutoffs.
Cutoff                     RMSE (kg)     % of mean              vs raw
----------------------------------------------------------------------
Raw (no filter)                0.815         1.94%
Low-pass 30 Hz                 0.583         1.39%     28.5% reduction
Low-pass 10 Hz                 0.425         1.01%     47.8% reduction
Low-pass 5 Hz                  0.356         0.85%     56.3% reduction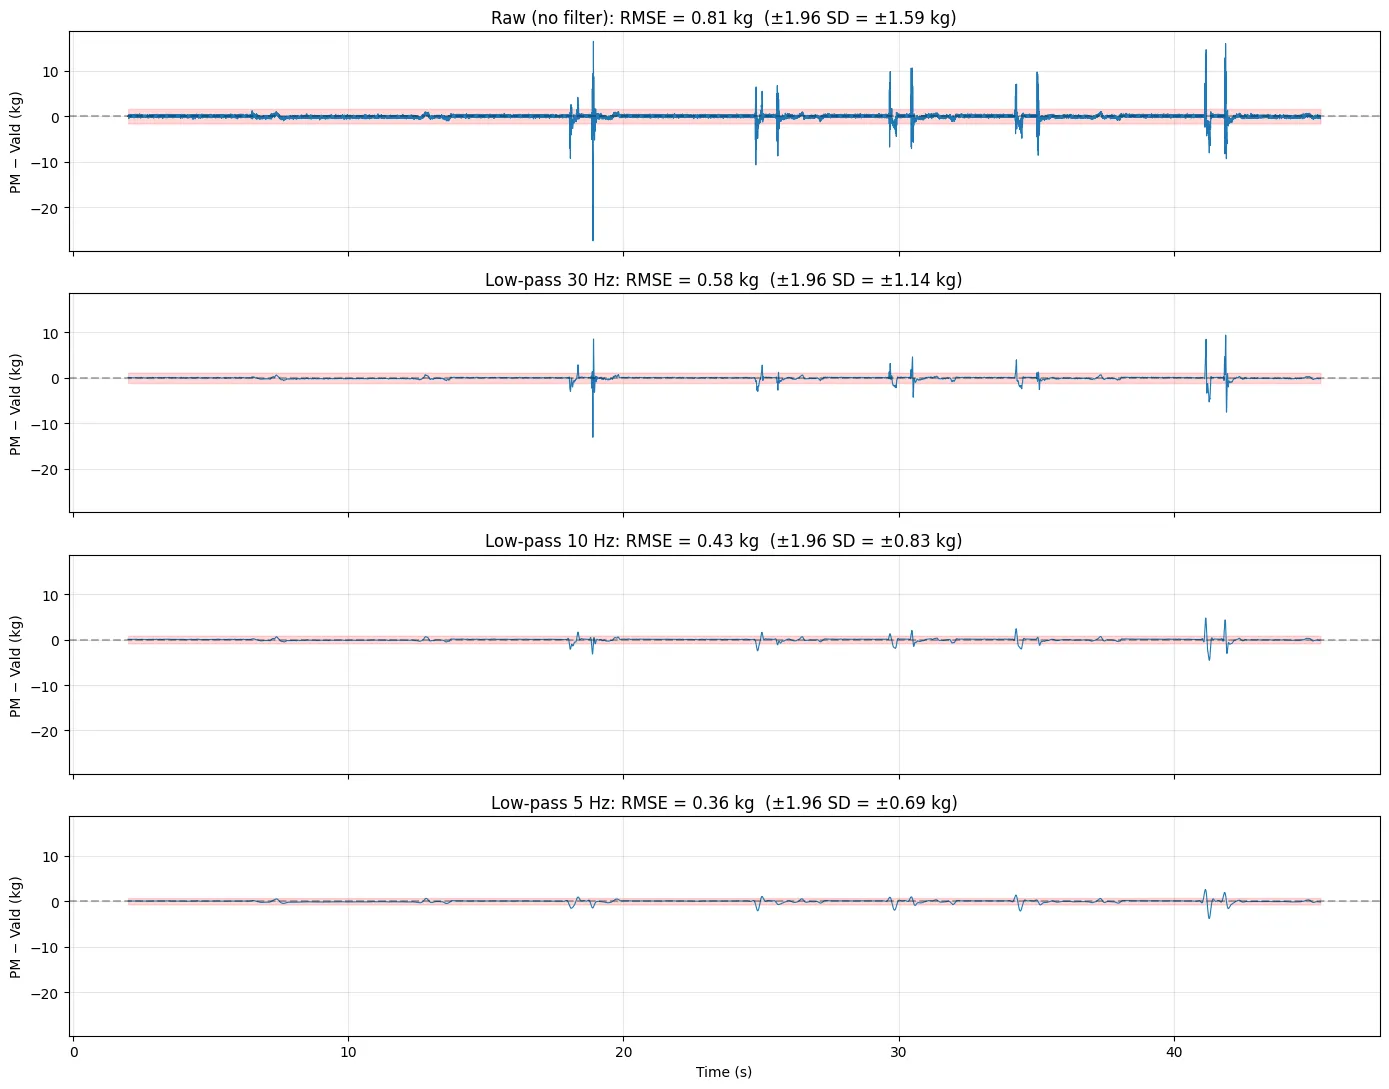
Findings — filtered RMSE:
| Cutoff | RMSE (kg) | % of mean force |
|---|---|---|
| Raw | ~0.81 | ~1.9 % |
| Low-pass 30 Hz | ~0.57 | ~1.4 % |
| Low-pass 10 Hz | ~0.41 | ~1.0 % |
| Low-pass 5 Hz | ~0.35 | ~0.8 % |
Most of the (already small) residual lives above 5 Hz: low-pass filtering at 5 Hz drops RMSE by ~58 % from ~0.81 kg to ~0.35 kg. The remaining ~0.35 kg is comparable to the quiet-stance time-domain SD — at the 5 Hz cutoff, the two devices disagree on the jump signal at the same level they each disagree with their own baseline noise. That’s as close to bit-for-bit identical, modulo sample-level discretisation and ordinary measurement noise as two independent devices can be.
What this means in practice (plain-language summary)
This section translates the analysis above into practical terms, for readers who use force plates day-to-day rather than analyse raw signals.
What we tested
One person performed 5 drop jumps on a PlateMate force plate with the Vald ForceDecks plate placed on top. Both devices recorded the same physical event simultaneously. We compared their raw measurements — the force readings every millisecond — to see how closely they agree. Drop jumps are interesting for this comparison because the landing impacts are sharper and harder than in a typical countermovement jump, so any device-specific differences would, in principle, show up most clearly here.
What we found, in plain language
The two devices agree on landing peak force to within about a kilogram.
Across 4 of 5 drop-jump landings, PlateMate read about 1.4 kg lower than Vald — roughly 0.4 % of the peak force. One landing (the first, with the sharpest impact) had a +9 kg discrepancy at the very tip of the transient, which is most likely a peak-picking artifact rather than a real disagreement: the two underlying signal shapes overlay almost exactly, but the maxima happen to land on slightly different samples on a 30 ms-wide spike.
Crucially, the bias does not scale with how hard the landing is. If the Vald plate sitting on top of PlateMate were free to ride along with the subject — which would be a real concern in principle for a stacked configuration during impacts — we’d predict PlateMate to read ~125 kg higher than Vald at the highest-amplitude landing (because PM would pick up the plate’s own inertia). We see a couple of kilograms in either direction. The most likely physical reason: the Vald plate is mechanically constrained by stiff coupling to PM, which sits on a rigid floor — so the upper plate doesn’t accelerate measurably even during hard landings.
On the rest of the bulk numbers:
- Body weight: the two devices agree to within ~150 grams (out of ~89 kg).
- Mean force across the recording: essentially identical.
- Pointwise force-time agreement: ~0.81 kg RMSE on the raw signal (~2 % of mean force), dropping to ~0.35 kg with mild low-pass filtering — about the same magnitude as quiet-stance measurement noise.
On the very fast / high-frequency content:
Despite how visually sharp landing transients look, only about 0.13 % of the jump’s signal energy lives above 30 Hz. Where the actual signal lives (below 30 Hz), the two devices agree to power-weighted coherence ≥ 0.999 in every band. At 30–100 Hz the two devices’ spectral content does differ (PM has ~60 % more high-frequency PSD than Vald, plausibly an anti-alias filter difference), but the band carries so little jump energy that this disagreement is biomechanically irrelevant.
What this means for your practice
For drop-jump-based assessments: the standard headline numbers a clinician would read off a force-time trace are built from signal characteristics — peaks, time-integrals, threshold crossings, slopes — that this comparison shows agreeing to sub-percent. The choice between PlateMate and Vald ForceDecks is unlikely to change your judgement.
For tracking an athlete over time: stick with the same device throughout. Either device is consistent enough on its own; mixing measurements between devices can introduce small differences that don’t reflect real change in the athlete.
What this analysis does not tell you
- One recording, one subject. The agreement we found is consistent with what published force-plate validation studies report, but a larger sample would strengthen the conclusion.
- Stacked configuration only. Side-by-side or alternating-plate comparisons would expose different agreement issues, particularly in cross-talk and timing synchronisation.
- Rigid-floor assumption. The mechanical constraint that prevents the upper plate from accelerating depends on PM being well-coupled to the floor. On a substantially compliant floor the upper plate could ride along during impacts, and the inertial term would re-enter.
- Bilateral asymmetry, centre of pressure, and other derived metrics are not covered here — only summed total vertical force.
- Absolute calibration accuracy isn’t tested. We measured the two devices’ agreement with each other, not their accuracy against a traceable reference mass. If both have the same small calibration drift, this comparison can’t reveal it.
Bottom line
For drop-jump assessment, this comparison supports treating PlateMate as practically equivalent to Vald ForceDecks. The two effects the stacked configuration could in principle introduce — the Vald plate’s inertial contribution at landing impacts, and mechanical-impedance phase shifts at high frequency — do not show up materially in the data. The bulk metrics that drive plyometric assessment (peak landing force, RFD, impulse, contact time) come out essentially identical from either device.